Forecast

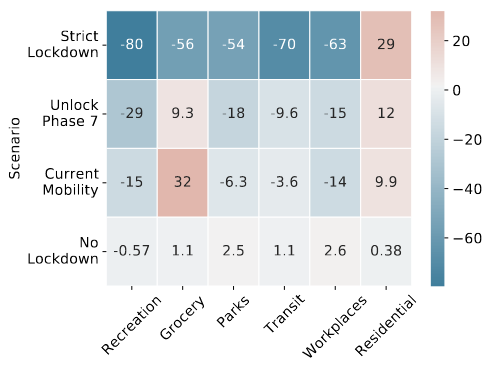
Our tool combines the observed patterns in the case counts from the past with additional factors like demographics (e.g., population density) and mobility (e.g., decrease in the percentage of people traveling for work due to lockdown) of the region.

Click Here for Technical Details.

National

National

State Level

State

District Level

State District

Statewise

Density Map

Daily case count per 100000 people

Third Wave

Nation Third Wave

Disclaimer:

Our predictions use mathematical models that rely on assumptions which may be violated in practice. While we rigorously validate our short-term forecast, doing so for third wave prediction is inherently more difficult. For example, our model does not consider movement of people across states/districts and these factors tend to add up over time making the long-term forecast more speculative in nature. We also have to rely on using approximate mobility values for future where the actual values are unobserved. However, we sincerely believe in the utility of these approximate results as they can help the country in developing a long-term strategy in its fight against Covid-19. We will continue refining our predictions as more data becomes available and as we switch to more sophisticated models.

Validation

The plots below compare our forecast for the previous two weeks against the observed case counts

National

National

State Level

State

District Level

State District

Statewise
Error Heatmap

Ratio between absolute error and actual case count over the validation period

About

In the last one and a half years, more than 17 Crore cases and 37 Lakh deaths have been reported worldwide due to Covid-19. This has been a devastating time for everyone. Recently, the sudden rise of cases in India, the second wave of infections, prompted strict lockdowns across the country. While these lockdowns effectively curb the spread of the virus, they often come with severe emotional and financial consequences that tend to outlast the lockdown itself. Science-based and data-driven policies for enacting lockdowns at local levels are the need of the hour. Our tool can help policymakers identify local regions that must go into lockdown mode to control the infection rate. Arguably, such local lockdowns would offer a sounder alternative to state-wide or nationwide lockdowns.

This tool is powered by powerful machine learning techniques. We collect data at three levels: country, state, and districts. This data is used to forecast the daily case counts at each of these levels in the future. Our tool combines the observed patterns in the case counts from the past with additional factors like demographics (e.g., population density) and mobility (e.g., decrease in the percentage of people traveling for work due to lockdown) of the region. These forecasts can be used by policymakers to strategically enact lockdowns in those places that are deemed vulnerable in the near future.
Data Sources:

Historical case counts were taken from covid19india.org Mobility data was obtained from Google